| Home | Open Account | Help | 308 users online |
|
Member Login
Discussion
Media SharingHostingLibrarySite Info |
Western Railroad Discussion > interpreting track profilesDate: 01/01/18 15:48 interpreting track profiles Author: webmaster How does one interpret track profile charts like the SP one I attached? Are the values shown the maximum grade between the two points?
Todd Clark Canyon Country, CA Trainorders.com 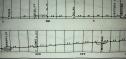 Date: 01/01/18 16:19 Re: interpreting track profiles Author: CPRR Yes, that is right. The slope degrees are shown in between the lines.
Posted from iPhone Date: 01/01/18 16:19 Re: interpreting track profiles Author: dsrc512 Yes, they are, expressed as a percent grade. The steepest grade shown, 1.0 is a one per cent grade.
Alex Huff Edited 2 time(s). Last edit at 01/01/18 16:21 by dsrc512. Date: 01/01/18 16:21 Re: interpreting track profiles Author: trainjunkie Each vertical line is a mile and the grade shown between them is the maximum for that mile. The “ruling grade” is the maximum grade in the entire grade section (between flat sections). Some track charts show much more information than this example.
Date: 01/01/18 16:39 Re: interpreting track profiles Author: railstiesballast Those look like condensed profiles that were put into ETTs for a while to give the engineers a better idea of the terrain they were passing through.
An engineering track chart often has more detail on grade changes, these just summarized the grade within each mile. Often an engineering chart is not on a graphical scale, but also includes curvature, weight of rail, bridges, etc. A detailed profile usually dates from original construction and shows, to a vertical scale, the rise and fall of the original terrain and the finished track profile. Date: 01/01/18 17:13 Re: interpreting track profiles Author: SCAX3401 This is a Union Pacific track chart for a portion of the section you posted above. Note the mileposts aren't the same as UP changed the mileposts slightly after taking over from the SP.
 Date: 01/01/18 18:17 Re: interpreting track profiles Author: webmaster railstiesballast Wrote:
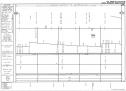
------------------------------------------------------- > Those look like condensed profiles that were put > into ETTs for a while to give the engineers a > better idea of the terrain they were passing > through. Sort of. It was booklet titled "Western Region Track Profiles" I acquired many years ago from Ken Meeker and appeared to come of the WR-43 desk because that is written on the cover. > An engineering track chart often has more detail > on grade changes, these just summarized the grade > within each mile. Often an engineering chart is > not on a graphical scale, but also includes > curvature, weight of rail, bridges, etc. > A detailed profile usually dates from original > construction and shows, to a vertical scale, the > rise and fall of the original terrain and the > finished track profile. In searching the web I found a chart for a portion of the Santa Paula Branch. Doesn't show grades, but shows an interesting assortment of rail that was installed on this line. Looks like whatever was laying around was used. I suppose this is typical of branch lines. Todd Clark Canyon Country, CA Trainorders.com 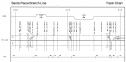 Date: 01/01/18 18:21 Re: interpreting track profiles Author: webmaster BNSF6400 Wrote:
------------------------------------------------------- > This is a Union Pacific track chart for a portion > of the section you posted above. Note the > mileposts aren't the same as UP changed the > mileposts slightly after taking over from the SP. That UP one was pretty neat. I like how the legend includes wig wags. How many are left on UP lines? Are these charts pretty accurate, as in are they reliably updated as improvements are made? Todd Clark Canyon Country, CA Trainorders.com Date: 01/01/18 18:39 Re: interpreting track profiles Author: ble692 webmaster Wrote:
------------------------------------------------------- > That UP one was pretty neat. I like how the legend includes wig wags. How many are left on UP lines? Check out Dan's Wigwag Site for the exact details. http://www.trainweb.org/dansrailpix/WIG_WAG_PAGE1c.htm I count 4 left on the UP system, all in California: Oakdale, Anaheim, Hawthorne, Gardena (Hobart) Date: 01/01/18 18:50 Re: interpreting track profiles Author: upkpfan Todd,
Also o that chart that you showed, the vertical lines with a V on both ends is a drainage structure of some type. It should tell you above the lines what type it is and you can look in the front of the book to determine exactly what type it is. The two I have show a lot more info. upkpfan Date: 01/01/18 19:16 Re: interpreting track profiles Author: SCAX3401 webmaster Wrote:
------------------------------------------------------- > That UP one was pretty neat. I like how the > legend includes wig wags. How many are left on UP > lines? Are these charts pretty accurate, as in > are they reliably updated as improvements are > made? THe UP and BNSF track charts are usually pretty accurate. They are updated as changes take place in the field. I think the current software "draws" them from several databases (bridge, rail, signal) and when the time comes for new ones to be issued, they simply hit the "generate" button and out they come. This is how the CSX track charts are done for sure. Date: 01/01/18 19:23 Re: interpreting track profiles Author: MP683 From what I have seen, the engineering ones (as shown above) are the most accurate.
What is enclosed with ETT’s are general profiles, usually in five mile lengths. There is a public website out there that was meant unofficially for rails and blends both into one. One railroad actually had them on its internal site until deemed too much out of date. The grades are generally the same, but signals and other railroad items change. I keep a copy of the “blended” third party with me which helps for grade securement. Date: 01/01/18 20:12 Re: interpreting track profiles Author: railstiesballast Keeping track charts up to date as each segment of rail is replaced, bridges are replaced, tracks are added or removed, signal systems are changed, and speed restrictions are changed is a never ending duty.
Date: 01/02/18 06:20 Re: interpreting track profiles Author: mamfahr webmaster Wrote:
------------------------------------------------------- > How does one interpret track profile charts like > the SP one I attached? Are the values shown the > maximum grade between the two points? Hello, The profile you provided is not from a typical RR engineering chart, it's greatly simplified as others mentioned. If you compare the two charts you can see that the grades appearing in your chart are not the maximum grades but rather the average grades between the points shown (usually mileposts. Take care, Mark Date: 01/02/18 07:19 Re: interpreting track profiles Author: mile250 "Ruling grade" is a bit more complicated. It depends on the overall profile and the length of trains operated on the line. It may not be the steepest segment between level portions, especially where there is an undulating profile. (Source: AREMA's Practical Guide to Railway Engineering.)
Date: 01/02/18 08:13 Re: interpreting track profiles Author: xrds72 As RTB says, keeping the track chart up to date is never ending, but it pays off. When I was DE in Chicago for CP, copies of my track chart was the one that was asked for whenever there was a special trip over the division that needed such info because everyone knew I never went out on the track without it and was constantly making changes. It seemed that the book was extra thick due to the layers of whiteout on the pages. (that was the pre-computer technology for corrections)
Date: 01/02/18 08:27 Re: interpreting track profiles Author: TAW xrds72 Wrote:
------------------------------------------------------- > As RTB says, keeping the track chart up to date is > never ending, but it pays off. When I was DE in > Chicago for CP, copies of my track chart was the > one that was asked for whenever there was a > special trip over the division that needed such > info because everyone knew I never went out on the > track without it and was constantly making > changes. It seemed that the book was extra thick > due to the layers of whiteout on the pages. (that > was the pre-computer technology for corrections) Railroads have outsourced, they call it, their engineering work, some of the profiles have deteriorated to the point of virtual uselessness, notr only not up to date, but not necessarily accurately representing the permanent features of the line. TAW Date: 01/02/18 08:33 Re: interpreting track profiles Author: mamfahr > ... The “ruling grade” is the maximum grade in the
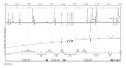
> entire grade section (between flat sections). Howdy, "Ruling grade" is something the operating dept, rather than the engineering dept., is concerned with. It may be the max. grade (greatest slope) but doesn't have to be. In basic terms, the ruling grade is the grade that is the most difficult for trains to get over on a particular subdivision. Many factors come into play in determining the ruling grade, such as the % grade at each location, length of grades, profile of track ahead of and beyond the max grade, operating speeds in the area, curvature (% of track in a curve as well as degrees of curvature), prevailing moisture/weather conditions, train and locomotive characteristics, etc. Take care, Mark Date: 01/02/18 09:17 Re: interpreting track profiles Author: trainjunkie We do not have condensed track profiles issued to us on the Alaska Railroad. We have track schematics in the employee timetable, but nothing in them is to scale and they don't show gradient. We are issued, however, full track charts. Here is one page showing the line from MP 155 to MP 160. They are quite detailed. This one is obsolete, but it provides a good idea of what is shown in them.
 Date: 01/02/18 09:18 Re: interpreting track profiles Author: EMDSW-1 webmaster Wrote:
------------------------------------------------------- > railstiesballast Wrote: > -------------------------------------------------- > ----- > > Those look like condensed profiles that were > put > > into ETTs for a while to give the engineers a > > better idea of the terrain they were passing > > through. > > Sort of. It was booklet titled "Western Region > Track Profiles" I acquired many years ago from Ken > Meeker and appeared to come of the WR-43 desk > because that is written on the cover. > > > An engineering track chart often has more > detail > > on grade changes, these just summarized the > grade > > within each mile. Often an engineering chart > is > > not on a graphical scale, but also includes > > curvature, weight of rail, bridges, etc. > > A detailed profile usually dates from original > > construction and shows, to a vertical scale, > the > > rise and fall of the original terrain and the > > finished track profile. > > In searching the web I found a chart for a portion > of the Santa Paula Branch. Doesn't show grades, > but shows an interesting assortment of rail that > was installed on this line. Looks like whatever > was laying around was used. I suppose this is > typical of branch lines. Note that both three degree curves had the original rail relaid with 132 (assume jointed since it doesn't specify CWR) where the tangents were a mixture of whatever was surplus from the main lines. Dick Samuels Edited 1 time(s). Last edit at 01/02/18 09:21 by EMDSW-1. |