| Home | Open Account | Help | 349 users online |
|
Member Login
Discussion
Media SharingHostingLibrarySite Info |
Eastern Railroad Discussion > CSX / NS Car Loading 2018 Vs 2019Date: 07/18/19 15:00 CSX / NS Car Loading 2018 Vs 2019 Author: NSSpike In lite of two previous posts:
CSX earnings released on Tuesday PM (updated) https://www.trainorders.com/discussion/read.php?2,4829720,page=1 Foote is Baffled by the Economy https://www.trainorders.com/discussion/read.php?2,4830800 I thought I'd do some comparing of both Class 1's car loading numbers as reported to the STB for week #28 2018 Vs 2019. The surprise for me was the coal commodity category for week #28 2019. CSX Total Originated & Received 13,699 NS Total Originated & Received 15,530 And although coal is down overall I would have thought CSX would have led in that category. Shows you what I know!! The chart below shows some interesting numbers as it relates to the metric of Car Loadings as reported by both Class 1's. NOTE: Lets all keep our replies civil on this please. Thanks in advance!!! Phil Maton Villa Rica, GA 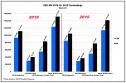 Date: 07/18/19 16:15 Re: CSX / NS Car Loading 2018 Vs 2019 Author: Tominde A good little snapshot. I'm sure all kinds of armchair economist have their explanations. Meanwhile the stock ,arket continues to climb.
Date: 07/19/19 03:08 Re: CSX / NS Car Loading 2018 Vs 2019 Author: Retired_Chief A quasi-wise man always told me that rail traffic was a leading (rather than lagging)
indicator of economic health. In other words, the 20 or so consecutive weeks of traffic declines 'MAY' forshadow an economic downturn. FWIW. I am not a financial advisor. Do your own due diligence. Date: 07/19/19 04:43 Re: CSX / NS Car Loading 2018 Vs 2019 Author: CSX602 CSX coal loadings 2019 year to date: 436,131 (up 1.9% from 428,204 same period 2018)
NS coal loadings 2019 year to date: 482,342 (down 4.3% from 503,944 same period 2018) Overall those weekly reports fluctuate a lot so you have to either look at year to date numbers or at least a few weeks... One example is that the last reporting week grain shipments were way up, and this week are down. Also, CSX coal loadings do not include those of the A&O lines that used to be CSX. Edited 1 time(s). Last edit at 07/19/19 05:15 by CSX602. Date: 07/19/19 05:49 Re: CSX / NS Car Loading 2018 Vs 2019 Author: rhotond After the Conrail split and for several years, CSX had a 10 to 20% lead over NS in most categories primarily due to the higher mileage of their system. Note that NOW NS has a 10 to 20% lead over CSX due to inept management and Greed of CSX.
r |